Most teams do not actually need “another quote.” They need a simple way to answer one question: what will we really pay if we grow from 10 to 50 to 200 seats over the next three years? A realistic contact center software cost calculator starts from that point of view. It focuses on total cost of ownership across licenses, minutes, AI, storage, and migration effort, instead of the single per seat number on a sales slide. This guide walks through three practical scenarios, shows how to model them, and gives you benchmarks so you can tell whether a proposal is in the right band or quietly setting you up for budget pain.
1. Why You Need a Cost “Model,” Not Just a Price Per Seat
Per seat pricing feels simple. In reality, it hides the things that make or break your budget: voice usage, AI features, recording, and implementation. A vendor that looks cheap at 20 agents can become the most expensive once you add toll free numbers, omnichannel, and call recording that satisfies compliance. A better approach is to build a single cost model where you list each component, apply realistic usage assumptions, and then plug in vendor numbers. That is how serious teams compare options like full cloud contact center suites with integrated routing and analytics against lighter VoIP-first stacks.
Once you have that model, conversations change. You are no longer reacting to whatever bundle a vendor proposes. Instead, you give them your expected seat ramp, regions, and feature set, and then ask them to map their pricing into your structure. That is the fastest way to see where you are overpaying for unused features or underestimating the cost of AI, storage, and long term support.
2. Variables That Actually Drive Your Contact Center Cost
Every “what will it cost us?” conversation eventually comes back to the same set of levers. On the people side, seat count, concurrency, and shift design determine license needs. On the traffic side, the big drivers are inbound vs outbound mix, geography, and whether you run toll free or only local numbers. On the stack side, the weight sits in routing complexity, omnichannel breadth, and how deeply you integrate with CRM, helpdesk, and existing PBX systems, especially if you are mid migration from a legacy platform as described in modern PBX cost blueprints.
Layered on top is AI. Every decision about transcription, summaries, agent coaching, and automated QA has a cost curve attached. If you treat those as unlimited add ons, the bill will surprise you. If you treat them as tools to reduce handle time and after call work in targeted queues, like the stacks aligned with handle time reduction benchmarks, you can tie each AI dollar to a clear productivity gain.
3. Scenario One: 10 Seats Testing Fit and Basic Economics
At 10 agents, your priority is validation. You want to know if the platform fits your workflows, if reporting is deep enough, and whether the bill tracks roughly with your expectations. At this stage, pick a vendor that can be configured quickly and does not force you into heavy migration projects. Cloud native setups with browser calling, simple IVR, and tight CRM connectors, like lean deployments inspired by small business VoIP architectures, tend to keep implementation costs under control.
Your 10 seat calculator should include: 10 named or concurrent licenses; expected inbound and outbound minutes in your core regions; minimal numbers portfolio; and storage assumptions for three to six months of recordings. Add modest AI usage for transcription or summaries in one or two queues if you want to test productivity gains. At this stage, it is better to keep contracts short, even if that means slightly higher per seat pricing, so you can change direction without paying years of penalties.
4. Scenario Two: 50 Seats With Serious Volume And Reporting Needs
At 50 seats, you can no longer treat the platform as an experiment. The contact center is now tightly connected to revenue and customer satisfaction. This is the point where routing design, resilience, and integrations must look like a proper architecture, not a patchwork of tools. Many teams move fully into cloud contact center platforms here, leaving behind older PBX setups described in legacy migration stories. The real risk at 50 seats is paying for features you never operationalize.
Your calculator should now add: at least one dedicated reporting or workforce management module; multiple queues with skills based routing; and broader recording coverage for training and compliance. AI usage often expands to auto logging, suggested responses, and partial AI QA, especially in high volume queues. If you are multi region, factor in more numbers, potential toll free lines, and any data residency fees for markets like the EU or GCC. This is also the stage where longer term contracts can make sense if you have validated fit and want better discounts.
5. Scenario Three: 200 Seats Where Automation And QA Decide Margins
At 200 seats, inefficiency compounds. Small leaks in routing, bad reporting, and manual QA processes translate into large budget gaps. The architecture and reliability practices you see in serious cloud builds, like those aimed at zero downtime telephony, stop being “nice to have” and become minimum requirements. Economies of scale appear, but only if your calculator shifts from “what do we pay per agent” to “what do we pay per resolved contact and per successful outcome.”
Now your model should include: full AI transcription for most queues; AI summaries feeding CRM; extensive AI QA to cover near 100% of calls; and dedicated analytics or BI exports for deeper analysis. Workforce management, quality teams, and operations analysts become line items in their own right. At this scale, it often makes sense to consolidate tools and prefer a platform that offers native integrations, predictive routing, and AI coaching similar to the stacks used in AI coached contact centers, even if per seat pricing looks higher, because it shrinks labor per interaction.
6. How AI And Automation Change The Cost Curve
AI is not a simple add on in your calculator. It changes the shape of your curve. You move from paying mostly for human hours to paying for a mix of human time and machine processing. The mistake is to buy every AI feature and then use it everywhere. A more disciplined approach is to treat AI as a targeted tool: start where you have the most after call work or the highest QA burden, as in the transformations described for AI first quality programs. Prove that AI reduces time spent per call or improves conversion rates, then widen the rollout.
In your calculator, give AI its own section. List transcription, summaries, coaching, and QA, and next to each write the specific metric it should improve: handle time, wrap time, compliance coverage, or upsell conversion. Estimate minutes or calls per month that will be processed. When you plug in vendor unit prices, you will quickly see which features are affordable and which only make sense at higher volumes or in specific business lines. That is the difference between AI as a “tax” and AI as an investment.
7. Building Your Own Internal Cost Calculator
You do not need a complex app to build a cost calculator that leadership trusts. A single spreadsheet with the right structure is enough. Start with three tabs: 10 seats, 50 seats, and 200 seats. In each, list rows for licenses, minutes by country, numbers, storage, AI features, integrations, implementation, and support. Then add columns for unit price, quantity, and monthly and annual totals. Use patterns from modern contact center KPI frameworks to bring in volume and handle time assumptions.
Next, create a summary tab that pulls totals from each scenario into one view. This is the page you share with vendors. When you ask them to fill it, gaps show up instantly. If a vendor struggles to estimate implementation or hides critical AI unit pricing, that is a signal. The vendors that can engage at this level, and that already have reference architectures similar to SIP to AI cloud migrations, are more likely to be stable partners through your growth phases.
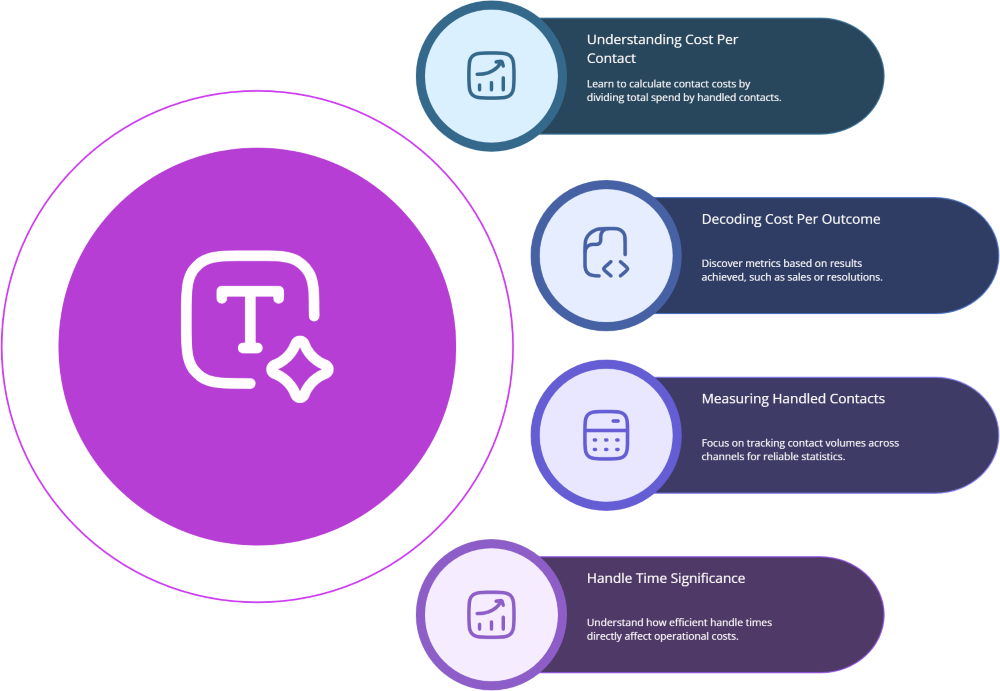
8. Benchmarks: Cost Per Contact And Cost Per Outcome
Raw monthly spend numbers are useful, but they do not tell you whether you are efficient. Two metrics do: cost per contact and cost per outcome. Cost per contact is simply your total monthly contact center cost divided by total handled contacts across channels. Cost per outcome is the same, but only for contacts that achieved the goal: a sale, a promise to pay, a successful support resolution. These are the metrics you use to compare platform choices and automation investments, similar to how vertical use case case studies talk about ROI.
A platform that looks more expensive per seat can still win if it reduces handle time, increases first contact resolution, or lifts conversion rates enough to lower cost per outcome. That is why your calculator should sit next to a metrics dashboard. If you can track changes in handle time, abandonment, and QA scores before and after a migration, you can tie pricing decisions directly to business results, not just procurement savings.