Most QA scorecards in 2026 look sophisticated in Excel and fall apart on the floor. They’re over-weighted on “soft skills,” under-weighted on outcomes, and impossible to align with what your WFM and CX leaders actually care about. At the same time, AI promises 100% coverage, instant summaries, and automatic scoring — but if you wire it on top of a broken rubric, you just scale bad judgement. This guide gives you seven practical QA scorecard templates and a clear framework for using AI as a precision tool, not a shortcut, so your reviews finally match the reality in your dashboards, NPS, and revenue reports.
1. Why your current QA scorecards are lying to you
The first problem is angle: traditional QA rubrics measure how “pleasant” a call sounded, not whether it actually solved the problem. An agent can tick every greeting and empathy box and still create a repeat contact, refund, or complaint. When you compare QA scores with hard metrics like AHT, FCR, and revenue per contact, the correlation is often embarrassingly low. That’s a sign your categories reward theatre, not outcomes.
The second problem is weight. Compliance and critical behaviours (disclosure, verification, security steps) might be worth 10–20% of the score, even though a single failure can cost you a fine or regulatory issue. In regulated environments, these should act as gates: miss them and the interaction is an automatic fail, no matter how strong the rest looks. Mature operations treat QA as part of risk management and business performance, not just a coaching tool bolted on after the fact.
2. The anatomy of a modern QA scorecard
A 2026-ready QA scorecard has four layers: hygiene, compliance, journey, and outcome. Hygiene covers basics: greeting, authentication, courtesy, and closing. Compliance enforces disclosures, scripts, and mandatory checks. Journey focuses on friction: how many transfers, how clearly the agent guided the customer, how well they handled tools. Outcome measures whether the customer’s underlying reason for contact was resolved, retained, or converted. That last layer is what should line up tightly with your routing, telephony, and CRM setup described in modern contact center architectures.
Each layer should have a small number of questions with clearly defined scoring rules. Avoid 40-item checklists. Instead, group related behaviours into a single line item with a rubric describing 0, 1, 2, or 3 points. This makes the scorecard easier to automate later with AI-based QA engines, because your model can detect patterns across segments instead of chasing dozens of micro-ticks.
3. Seven QA scorecard templates you can copy
Below is a reference table of seven QA templates matched to typical environments. The idea is not to adopt them blindly, but to pick one or two closest to your reality, then tune weights and questions to match your brand, industry, and risk profile.
For each template, break questions into 4–6 lines with clear scoring rules and examples of what a 0, 1, or full score sounds like. That makes calibration easier and prepares the ground for AI models to score segments reliably, instead of guessing from vague labels like “empathy” or “ownership.”
4. Wiring scorecards into metrics, routing, and reporting
A QA scorecard that lives only in spreadsheets is a cost center. To drive revenue and CX, it needs to talk to your telephony, CRM, WFM, and analytics stack. Start by tagging contacts at source: queue, language, campaign, product, and outcome. This mirrors the segmentation you probably already use in your routing and dialer flows, like the ones described in predictive routing playbooks. The goal is to see QA scores side by side with conversion, churn, and complaint metrics by segment.
Next, embed QA outcomes into your reporting cadence. Team leads should see daily and weekly QA summaries per queue, product, and agent, not just a monthly “scorecard report.” Operations should be able to pull views like “calls with high handle time and low QA” or “high QA, low CSAT” to find gaps between what your rubric rewards and what customers feel. Over time, you can refine your scorecards based on which behaviours move real numbers, using the same evidence-driven approach recommended in ROI-ranked feature evaluations.
5. How to use AI in QA without ruining accuracy
AI is best at three things in QA: finding patterns in large volumes, pre-scoring clear behaviours, and freeing human reviewers to focus on nuance. It is terrible at context it hasn’t been taught, edge cases, and brand subtleties if you just push raw transcripts into a generic model. Start small: use AI to detect structural behaviours (did the agent verify identity, give a disclosure, confirm next steps?) and to generate summaries, following the same constrained approach used in AI cost-reduction deployments.
Keep a human in the loop for grey areas like empathy, judgement calls, and complex negotiations. A good pattern is “AI proposes, human disposes”: AI drafts a score and commentary; reviewers approve, adjust, or override and explain why. Those corrections become training data so your models learn over time. At scale, you end up with near-100% QA coverage while keeping decision-making attached to people who understand your risk and brand voice.
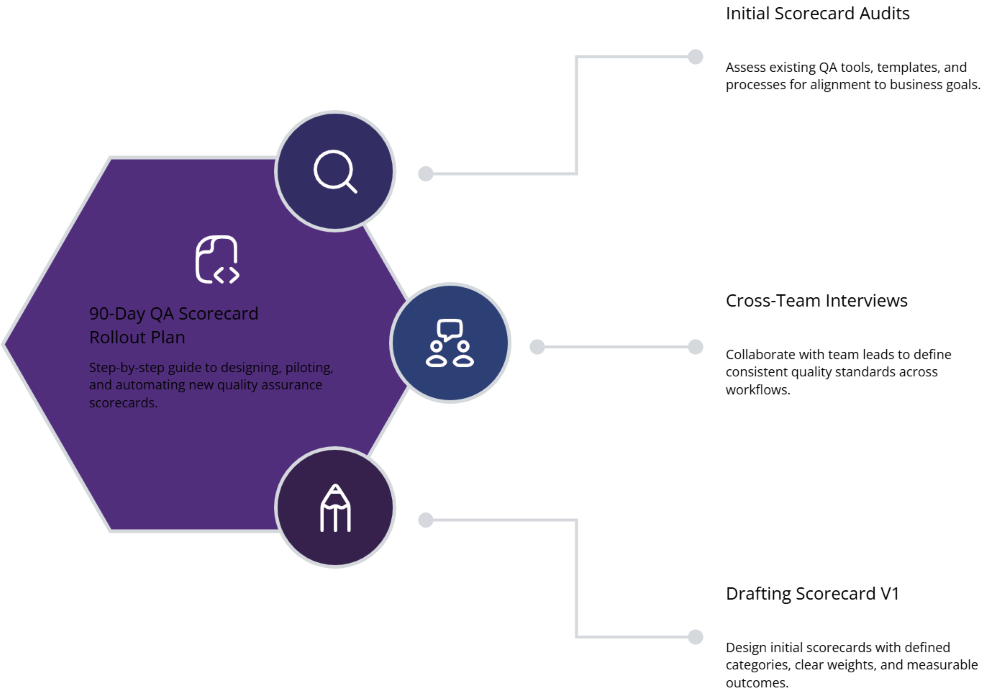
6. 90-day rollout plan for new QA scorecards
Days 1–30: Design and alignment. Audit your current scorecards, QA tools, and calibration processes. Interview operations, CX, legal, and sales leaders to define what “good” looks like per queue. Pick one or two templates from this guide that match your biggest volume or risk and draft V1 scorecards with clear categories and weights. Check they align with the routing logic, integrations, and telephony stack described in integration-focused stack maps.
Days 31–60: Pilot and calibration. Train a small group of QA analysts and team leads on the new scorecards. Run them in parallel with your old model for a subset of calls so you can compare scores and correlations with CSAT, FCR, and revenue. Hold weekly calibration sessions where multiple reviewers score the same calls and reconcile differences. Use this period to tune wording, weights, and examples; your goal is to minimise variance between reviewers while maintaining sensitivity to real quality differences.
Days 61–90: Automation and scale. Once the manual version is stable, start wiring AI into the process. Enable automatic detection for straightforward behaviours and use models to pre-score low-risk dimensions, drawing on patterns from AI-first QA programs. Expand the new scorecards to more queues and roll old ones off. Update your dashboards so leaders can see scores, comments, and trend lines without digging through spreadsheets, and make sure action plans are defined whenever a team or queue falls below your threshold.